Customer Satisfaction Metrics You Can Act on, Now
CSNook brings all your customer data — usage, engagement, lifecycle progress, and revenue indications — into one intuitive analytics dashboard. From retention signals to adoption metrics, get the clarity you need to measure performance and make data-backed decisions with confidence.
Gain Meaningful Insights from Every
Interaction
Usage Analytics
Monitor how customers adopt features, interact with your product, and evolve across lifecycle stages with data that uncovers hidden patterns of behavior.
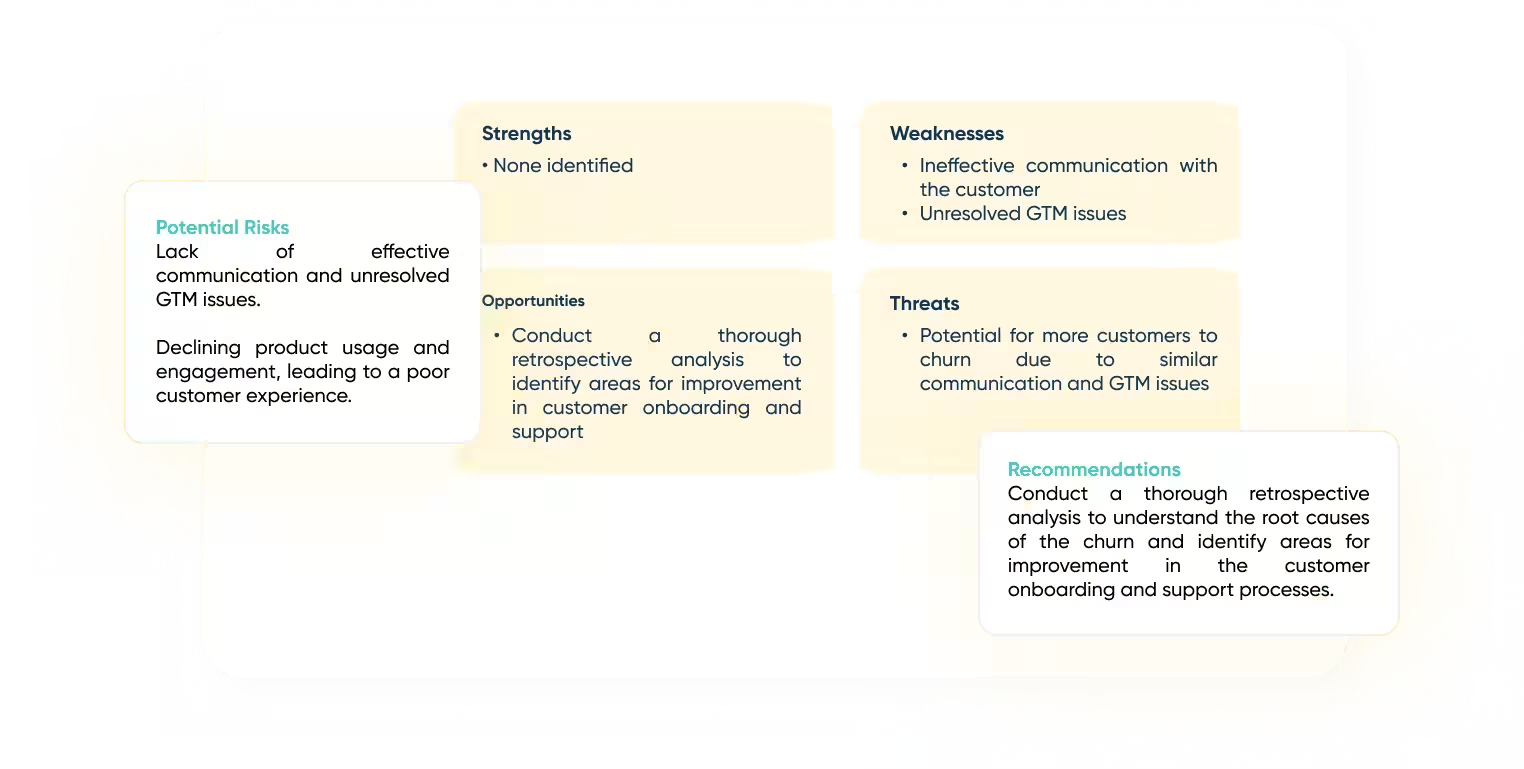
See Churn Risk
Think you might have disengaged users? Confirm it through trend analysis, activity drops, and sentiment changes so you can intervene in time.
Survey Your Customers
Couple data metrics with the actual lived experience of your customers to evaluate whether each account is on track or not.
Track Revenue Impact
Note how customer satisfaction metrics connect with renewals, expansions, and overall revenue health across accounts and segments.
Quarterly Business Reports
Uncover key moments, success wins and more through regular ROI-based reviews to understand the evolving role of CS teams.
Is Your Team Effective?
Review how CSM actions influence outcomes, track the completion of tasks and identify opportunities for improved workflow efficiency.
Make Customer Data Actionable
CSNook gives you the tools to always respond strategically, where your customers are concerned. Identify trends, anticipate risks and understand which actions create long-term customer success across every segment.
Build Sharper Strategy with Every Insight
Track Product Engagement
Not all features get adopted uniformly. Analyze the ones that drive adoption to get a clearer picture of product-market fit across customer groups.
Make your understanding of the customer the basis for product adoption.
Become an effective client relationship partner through smart onboarding support.
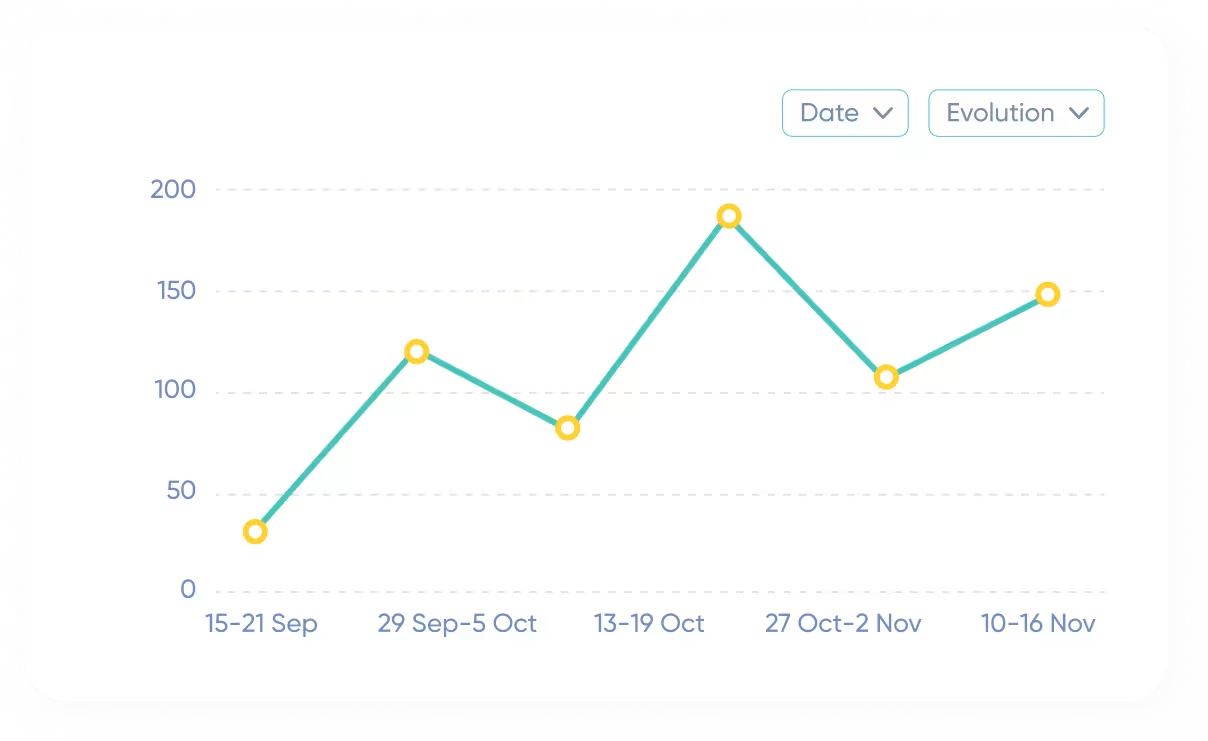

Understand Relative Health
Customers don’t behave exactly the same across time. View historical and current health trends over time to see inflection points in customer satisfaction metrics.
Pinpoint the exact moments where customers became high-risk, or engaged — and identify the reason.
See if team-assisted interventions are bearing fruit over a given time period.
Measure Category-wise Progress
Sort your customers and track progress like onboarding success, adoption depth, renewal strength, and expansion likelihood, across these cohorts.
Discover segments that require additional support or resources through regular client surveys.
Benchmark performance across products, plans, or regions, and check progress.

Connect Insights to Outcomes
Discover how customer behavior translates into revenue impact, from churn risk to upsell readiness and quarterly performance trends.
Find out if renewal likelihood stems from usage and engagement, and by how much.
Ensure all expansion plans are guided directly by measurable behavioral data.
Compete Through Data-driven Strategies
CSNook transforms customer signals into actionable insights so that your CS team always knows where to focus next. Replace guesswork with clarity, and power every single decision you make with meaningful analytics.
Frequently Asked Questions
How does CSNook measure customer satisfaction metrics?
CSNook measures customer satisfaction metrics by consolidating data from product usage, engagement trends, survey responses, lifecycle milestones and revenue indicators into a unified dashboard. This creates a holistic view of each customer’s experience and overall account health.
By continuously tracking these inputs, teams can identify patterns that indicate satisfaction or dissatisfaction. Over time, this allows for consistent benchmarking and improvement of customer success strategies.
This particular feature also ensures that decisions are based on real-time, reliable data rather than assumptions, helping teams stay proactive in addressing customer needs.
Do metrics on customer satisfaction help with churn?
Customer satisfaction metrics do play a critical role in identifying and preventing churn across industries and verticals. They highlight early warning signs such as declining usage, reduced engagement, negative sentiment or even a stalled onboarding progress.
Such signals help teams detect at-risk accounts before churn actually occurs, allowing for early intervention. Proactive actions like targeted outreach and support can then be implemented on a case by case basis.
Additionally, tracking these metrics over time helps refine retention strategies and improve long-term customer loyalty.
Can I analyze customer satisfaction trends over time?
Yes, CSNook allows teams to analyze customer satisfaction trends over time using real-time data along with historical insights. It can also integrate external data sources via APIs to provide a more comprehensive dataset. This enables teams to identify behavioral shifts, recurring patterns and key inflection points in the customer journey.
Such insights are valuable for long-term planning and optimization. By understanding how satisfaction evolves, businesses can continuously refine their engagement and success strategies.
How do customer satisfaction metrics improve team performance?
Customer satisfaction metrics improve team performance by directly linking customer outcomes with CSM activities and strategies. Teams can evaluate which actions lead to positive results and which actions may need adjustment.
Managers are able to track task completion rates across reportees, intervention effectiveness, and workflow efficiency to optimize team operations. This creates accountability and encourages data-driven improvements. This builds a procedural format wherein account managers and CSMs cannot shirk responsibility due to built-in transparency on the panel.
Over a period of time, these insights help standardize best practices, enhance productivity and ensure more consistent customer success outcomes across the team.
What metrics measure customer satisfaction?
Customer satisfaction is measured using a mix of quantitative and qualitative metrics, such as:
- Product usage data
- Feature adoption rates
- Engagement frequency
- Customer health scores
- Survey-based inputs like CSAT, NPS and feedback responses.
In totality, they act together to reveal friction zones, unmet expectations and notable drivers of client satisfaction across different lifecycle stages. By combining behavioral data with direct feedback, teams gain a more complete and actionable view of customer satisfaction.
How does NPS differ from other customer satisfaction metrics?
Net Promoter Score (NPS) differs from other metrics by focusing specifically on customer loyalty and likelihood to recommend, rather than just satisfaction at a given moment.
While CSAT measures short-term satisfaction and usage metrics track behavior, NPS captures long-term sentiment and brand advocacy. It provides a broader perspective on customer relationships and future growth potential.
When used alongside other metrics, NPS helps validate trends and uncover deeper insights into customer trust and retention drivers.