Acquiring a customer is often seen as a major milestone, but in relationship-driven businesses, it has never truly been the finish line. In a B2B environment, long-term success depends on how well companies are built and how they nurture and sustain their customer relationships over time.
Onboarding, adoption, satisfaction, and long-term value creation become necessary in this scenario. Customer success teams play their role here. They become the strategic growth engine. But the strategy works its way when there is clarity in the signals. These signals tell whether the customer is thriving, struggling, or even preparing to leave.
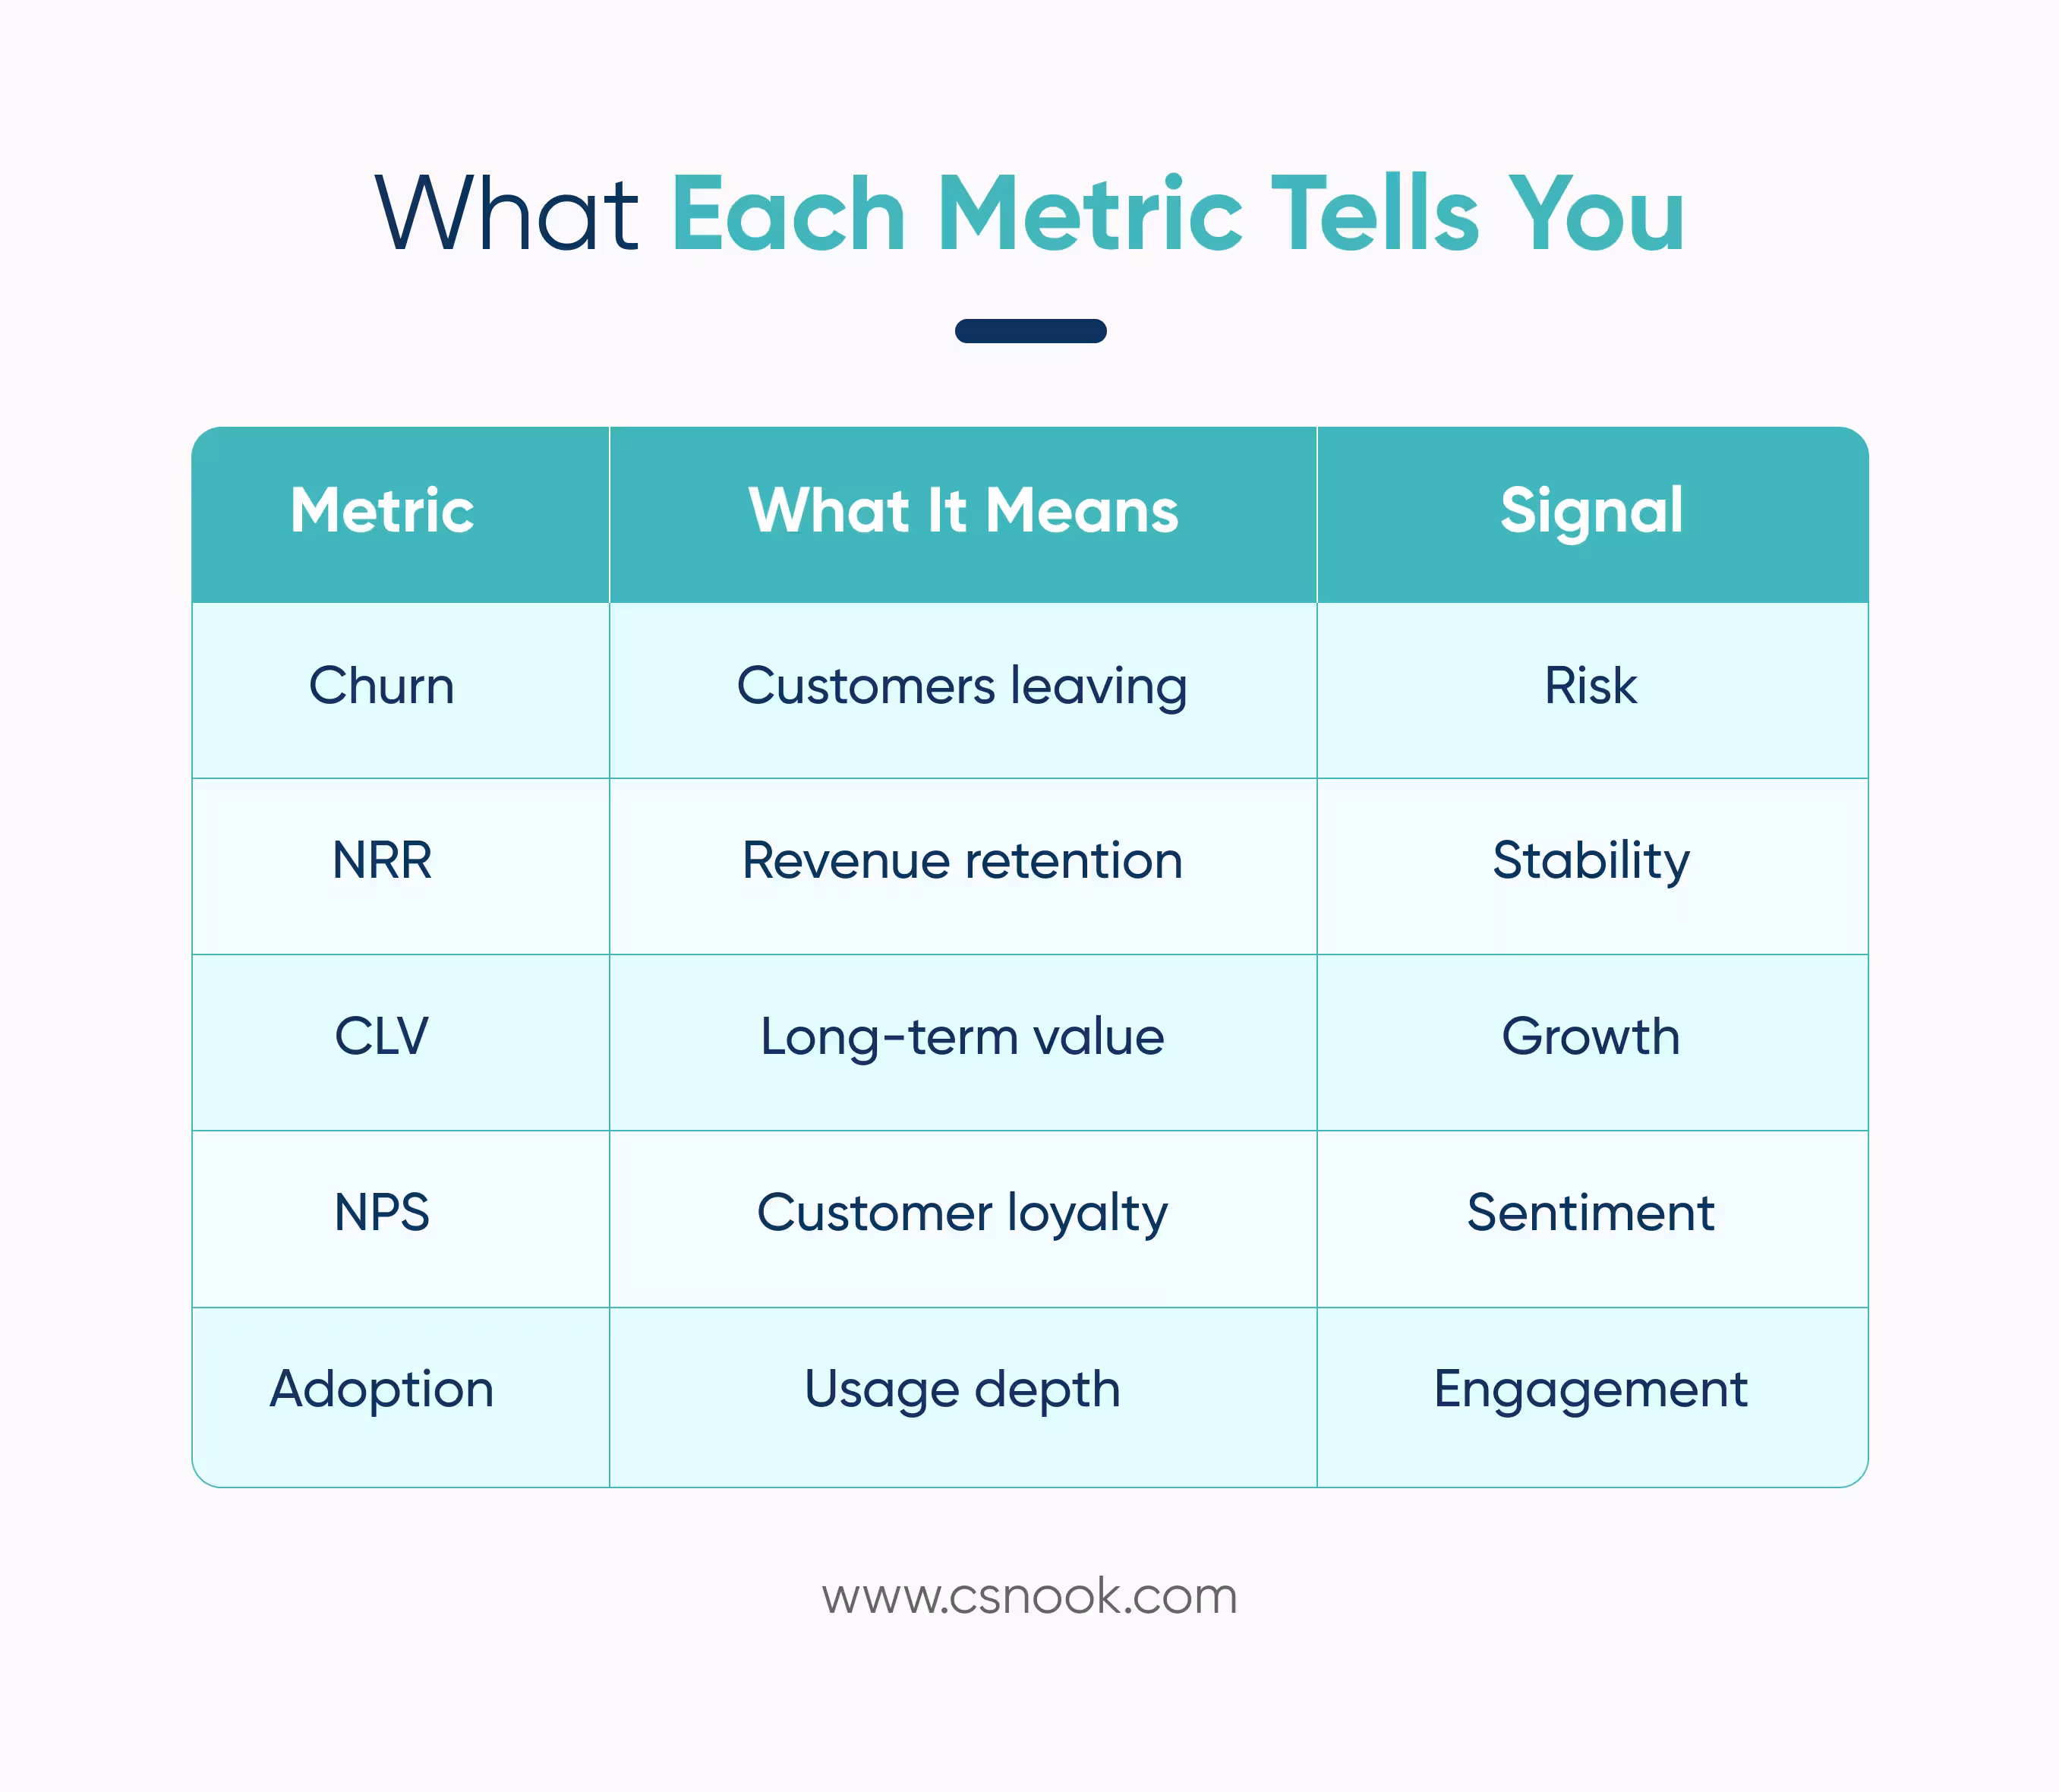
This is why understanding customer success metrics is a necessity. Metrics are measurements that help understand customer behaviour, which is ultimately the “signals” that the CS teams are searching for.
These metrics also help measure the effectiveness of their success initiatives. They ensure that teams can detect patterns early, and not when a churn account is sitting just around the corner.
This article aims to explore the essential metrics of customer success through its foundational pillars, which are –
- Retention
- Growth
- Customer Health
Let us now discuss them in detail.
Key Retention Metrics
Customer Churn Rate
Customer churn measures the percentage of customers who stop using the product or service within a specific period of time.
The formula to calculate this is –
Customer Churn Rate = (Customers Lost During Period / Total Customers at Start of Period) × 100
For instance, if a company starts a month with 500 customers and loses 25 of them, then the churn rate would be 5%.
A rising customer churn rate hints at deeper issues that often go unnoticed, such as –
- Poor onboarding
- Slow or low product adoption
- Communication gaps and misaligned expectations
- Weak engagement
By monitoring these customer success metrics, teams can figure out the risk patterns and take action before the customers leave.
Revenue Churn
Customer churn measures customers who are lost. Revenue churn, on the other hand, measures the recurring revenue that is getting lost.
This metric is important because oftentimes, losing a high-value customer creates more impact than losing several smaller customers.
There are two types of revenue churns, and these are –
- Gross Revenue Churn – Total recurring revenue that is lost
- Net Revenue Churn – Revenue that is lost even after upgradation and expansion
Revenue churn is important because it emphasises the financial impact of retention efforts.
Net Revenue Retention (NRR)
Net revenue retention measures the revenue retained from existing customers after accounting for churn, downgrades, and expansion.
The formula to calculate it is –
NRR = (Starting Revenue + Expansion − Churn − Downgrades) / Starting Revenue
An NRR above 100% suggests that the existing customers are driving more revenue than they did earlier.
Companies, hence, rely on strong customer success programs in order to have a strong NRR.
How to Improve Retention Metrics
Retention cannot be improved with just one intervention. It requires a whole structured customer success strategy. Some of the key actions that must be included in this strategy include –
- Building structured onboarding journeys
- Tracking early product adoption signals
- Conducting regular business reviews
- Proactively identifying risk signals
- Aligning customer outcomes with product value
It is through customer success metrics that the impact of these initiatives becomes measurable. Additionally, it also allows teams to refine their approach continuously.
Growth Metrics: Expanding Customer Value
Revenue is protected through retention and is multiplied through growth. A notable portion of revenue is generated from existing customers instead of new ones. This is why expansion-based metrics are essential.
They reveal how well the customers are progressing, adopting features and growing with the product. Some of the key metrics will be discussed below.
Expansion Revenue
Expansion revenue is the measurement of the additional revenue that is generated with the help of existing customers. This is done typically through upgrades, additional seats, feature add-ons, or usage increases.
How is it checked?
- First, look at the monthly recurring revenue that is derived from existing customers.
- Segment them on the basis of plan upgrades, additional licenses and add-on features
- Deduct the original contract value from the new values
Let us understand this with the help of an example –
If the customer’s original plan is that of $1,000/month, and their upgraded plan is that of $1,400/month. The expansion revenue would be $400/month.
What must be monitored here?
- Expansion revenue by account
- Expansion revenue by customer segment
- Expansion trends over time
Increasing expansion revenue suggests that the customer is gaining more value from the product.
Customer Lifetime Value
Customer lifetime value (CLV) is the estimate of the total revenue a customer can potentially generate during their entire journey with the company.
The formula to calculate it is –
CLV = Average Revenue per Account × Average Customer Lifespan
For example, if the average revenue per customer is $500/month and average lifespan: 36 months. Then the CLV would be $18,000
What must be monitored here?
- CLV by customer segment
- Changes in CLV over time
- CLV compared to customer acquisition cost (CAC)
Product Adoption Rate
Product adoption shows the depth to which the product is being used and how well it is being utilized by the customer.
Low adoption = potential churn
High adoption = growth potential
This is checked by tracking product usage data such as –
- Login frequency
- Feature usage
- Number of active users
- Completion of key workflows
The formula to calculate it is –
Adoption Rate = Active Users / Total Users
To monitor this, it is important to focus on the usage patterns such as –
- Trends of feature adoption
- Points where the customer usually drops off
- Adoption across customer segments
Customer Health Metrics: Focus on the Future
Customer health metrics are about future predictions. This can be done by combining multiple signals that help in understanding whether the customer is thriving, struggling, or at risk. Some of the key customer success metrics that come under this are as follows.
Net Promoter Score (NPS)
NPS checks the customer loyalty by asking them a single question, and that is,
“How likely are you to recommend this product to others?”
On the basis of this question, the customers respond on a scale of 0 to 10.
- Promoters: 9-10
- Passives: 7-8
- Detractors: 0-6
This helps identify which customers the advocate is and which dissatisfied customers are. This provides insights into customer sentiments and long-term loyalty.
Customer Satisfaction Score (CSAT)
CSAT is the metric used for measuring customer satisfaction post a specific interaction or experience. This could be –
- After onboarding
- After support interactions
- After feature usage
This is usually measured on the scale of 1 to 5 or 1 to 10.
CSAT works as a valuable customer success metrics as it aims to record immediate feedback and helps identify areas where the customer experience can be improved.
Customer Health Score
Customer health score combines multiple signals into a single indicator. This reflects on the overall situation of the customer relationship.
Some of the common inputs that can be taken into consideration in order to calculate the health score include –
- Product or service usage
- Customer engagement levels
- Support interactions
- Feedback scores such as NPS or CSAT
- Frequency of communication
With the help of these signals, customers can be classified into categories such as healthy, neutral or at risk.
A health score allows teams to prioritize their efforts and focus attention on customers who may require proactive support.
Why Customer Success Metrics Are Interconnected
Looking at the metrics in isolation will barely tell anything. Customer success actually becomes powerful when retention, growth and health are analysed together.
For example-
- A declining health score may indicate future churn
- Poor product adoption may reduce expansion opportunities
- Strong retention can potentially lead to higher lifetime value
All these signals reinforce each other and are interdependent in a way. Here is how –
- When customers are healthy, they stay longer.
- When they stay longer, they grow.
- When they grow, revenue increases too.
At the end of the day, it is this interconnectedness that becomes the make-or-break aspect.
Conclusion
Tracking these customer success metrics manually with the help of spreadsheets and disconnected systems can be overwhelming.
Customer success softwares simplify this process by –
- Centralizing customer data
- Automating health scoring
- Monitoring usage signals
- Detecting churn risks early
- Generating actionable insights
Instead of looking for scattered data, teams can focus on what actually needs to be focused on, and that is improving customer outcomes.
This is where tools like CSNook come into the picture. They help customer success teams translate raw customer signals into meaningful decisions.
Common Questions
What are customer success metrics, and why are they important for long-term business growth?
Customer success metrics are measurable indicators that are used to track how and if customers are achieving value from a product or service. They help businesses understand retention, engagement, and expansion opportunities. By monitoring these metrics, teams can identify risks early and strengthen relationships. They also ensure that customers continue to grow with the business.
Which customer success metrics are most important to track for improving customer retention?
Key customer success metrics for retention include customer churn rate, revenue churn, and Net Revenue Retention (NRR). These metrics reveal whether customers are staying, leaving, or reducing their engagement. Tracking them consistently helps teams identify dissatisfaction early and take proactive steps to improve customer experiences and loyalty.
How do customer success metrics help businesses identify growth opportunities within existing customers?
Customer success metrics such as expansion revenue, customer lifetime value (CLV), and product adoption rate highlight how customers interact with a product over time. When these metrics show increasing engagement or usage, they signal opportunities for upgrades, cross-selling, or even deeper partnerships with customers who can already see value.
What customer health indicators should teams monitor to predict customer churn risks?
Customer health indicators like Net Promoter Score (NPS), Customer Satisfaction Score (CSAT), and product usage trends help businesses predict future outcomes. These customer success metrics reveal whether customers are satisfied, engaged, or struggling, allowing teams to intervene early and prevent potential churn before it impacts revenue.
How can organizations track and manage customer success metrics more effectively?
Organizations can track customer success metrics more effectively by centralizing customer data, monitoring engagement signals, and using analytics tools that provide actionable insights. This approach allows teams to detect patterns in customer behavior quickly, prioritize at-risk accounts, and focus on strategies that improve retention, growth, and customer satisfaction.